Actions
Bug #1823
open
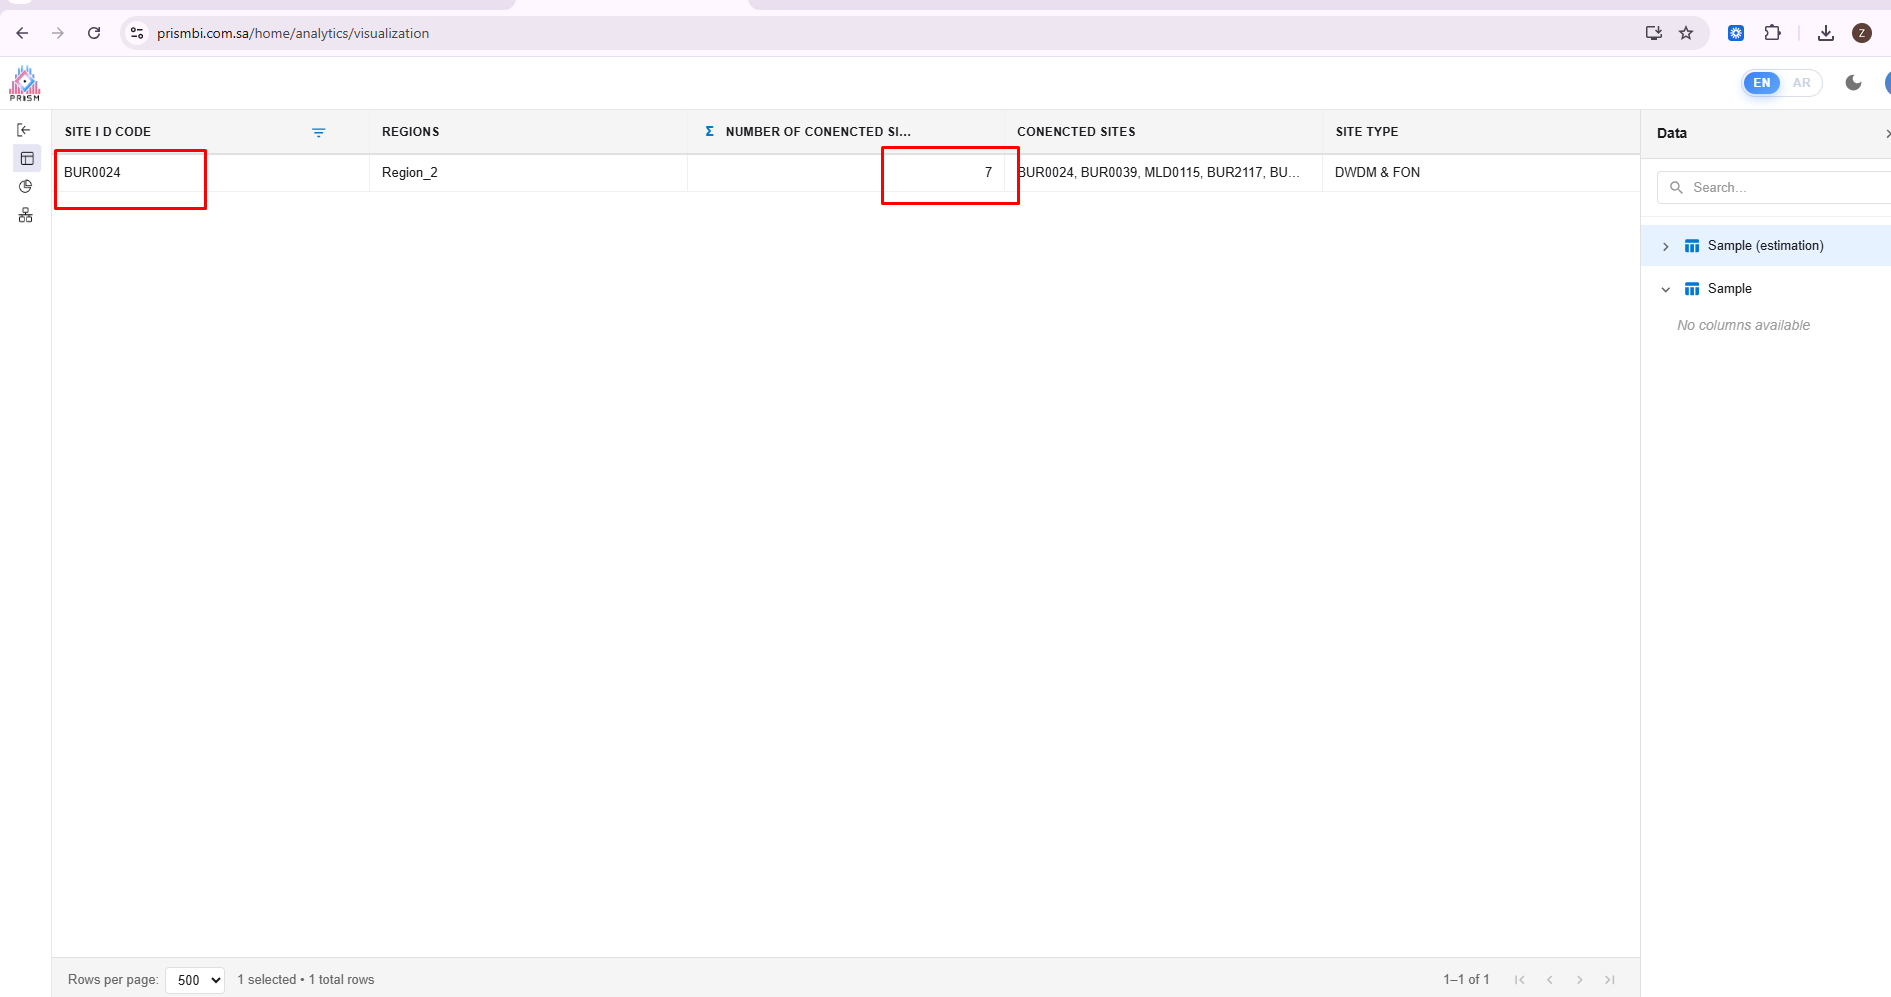
Output of chart is not correct - Basic filtering
Description
I filtered the data to show only record with site ID 'bur0024', in the data we have 7 connected sites against this site ID code, but on chart it shows 1 on prism and 7 on power BI (Correct Result). On prism the result is same through out the graph though.


Files
 Updated by Zoya Rashid about 3 hours ago
- File Estimation output.csv Estimation output.csv added
Updated by Zoya Rashid about 3 hours ago
- Subject changed from Output of chart is not correct - Advance filtering to Output of chart is not correct - Basic filtering
 Updated by ALi RAZA about 3 hours ago
- Status changed from New to Resolved
- Assignee set to ALi RAZA
- % Done changed from 0 to 100
if you can able to see the images. So see the aggregation function which you are using in the Prism Bi and Power Bi not same so that's why you are not getting the expected results so make sure whenever you are creating charts so they should be having same aggregation functions for parity with Power Bi...
Thank you...
Updated by Zoya Rashid about 2 hours ago
- Status changed from Resolved to Rejected
Actions